
JavaScript Memory Management
How JavaScript allocates, uses, and releases memory — stack vs heap, garbage collection algorithms, memory leaks, prevention tips, and interactive visualizations.
Introduction
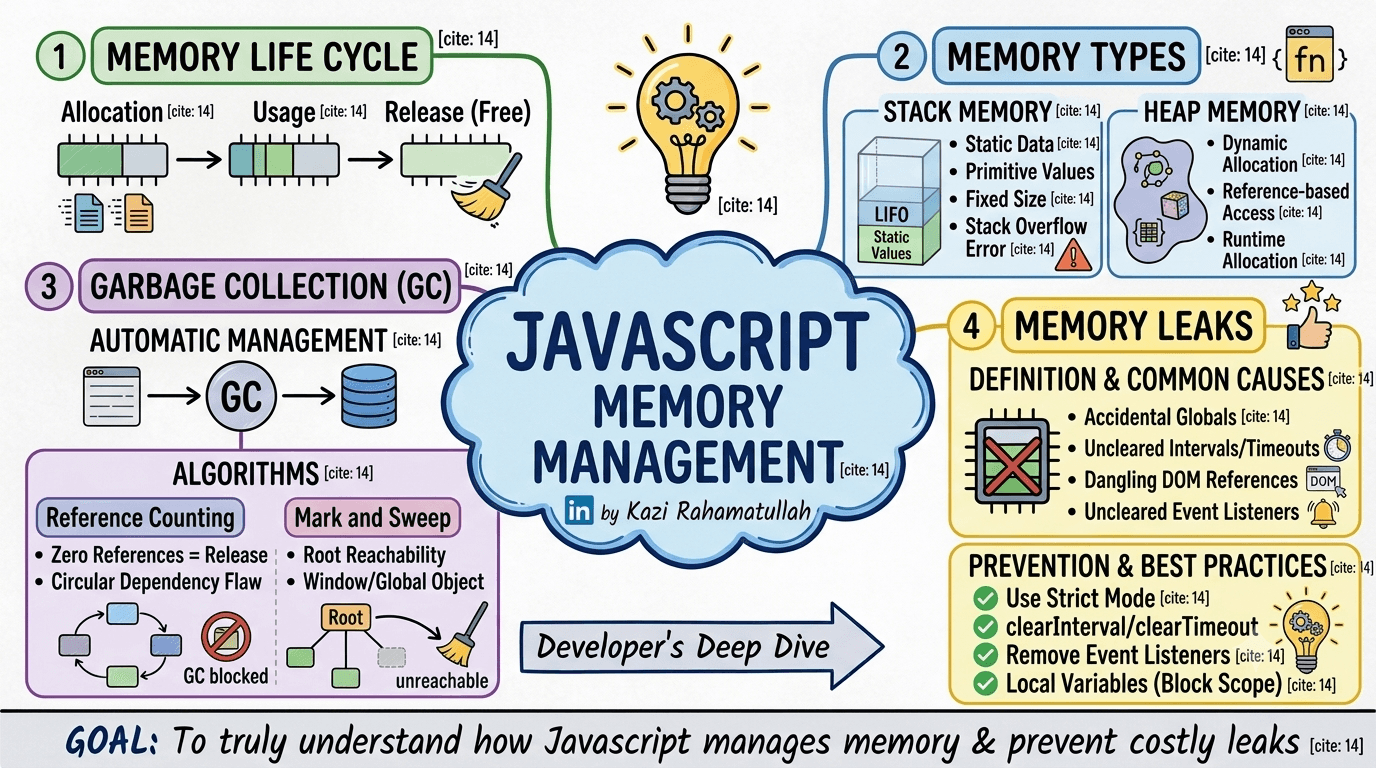
JavaScript manages memory automatically — you never call free() like in C. But automatic does not mean invisible. Understanding allocation, usage, and release helps you write faster apps, pass interviews, and avoid costly memory leaks in long-running SPAs.
This guide covers:
- The memory life cycle — allocate, use, release
- Stack vs heap — where values live
- Garbage collection — reference counting vs mark-and-sweep
- Memory leaks — common causes and fixes
- Best practices — strict mode, cleanup, profiling
Related reading: JavaScript Execution Context for stack frames and the call stack.
Course Reference
Quick index
| # | Section |
|---|---|
| 1 | Memory life cycle |
| ↳ Life cycle demo | |
| 2 | Stack vs heap |
| ↳ Stack vs heap visualizer | |
| 3 | Garbage collection |
| ↳ GC algorithms demo | |
| 4 | Memory leaks |
| ↳ Memory leak lab | |
| 5 | Best practices |
1. Memory life cycle
Every value in JavaScript goes through three stages.
| Stage | What happens |
|---|---|
| Allocation | Engine reserves memory when you create a value |
| Usage | Your code reads, writes, or passes references to the value |
| Release | GC reclaims memory when no references remain |
// 1. Allocation
const user = { id: 'u-1', name: 'Kazi' }

// 2. Usage
console.log(user.name)
user.role = 'admin'
sendToApi(user)

// 3. Release — when no references remain, GC can free the object
let cache = { data: [1, 2, 3] }
cache = null // removes reference; object becomes eligible for GCInteractive: memory life cycle
Memory Life Cycle
Step through allocation, usage, and release — the three stages every value goes through.
The engine reserves memory when you create values — primitives on the stack, objects on the heap.
2. Stack vs heap
JavaScript uses two memory regions.
| Region | Stores | Access | Lifetime |
|---|---|---|---|
| Stack | Primitives, execution context frames | Fast, LIFO | Freed when function returns |
| Heap | Objects, arrays, functions | By reference | Freed by GC when unreachable |
Stack — primitives and frames
let count = 42 // number on stack
let active = true // boolean on stack
let label = 'memory' // string value (engine-dependent; often interned or heap-backed)
Each function call pushes a stack frame. Deep recursion without a base case causes stack overflow:
function recurse() {
  recurse()
}
// recurse() // RangeError: Maximum call stack size exceeded
Heap — objects and references
const config = { theme: 'dark', locale: 'en' }
const copy = config // copies reference, not the object

copy.theme = 'light'
console.log(config.theme) // 'light' — same heap objectfunction makeBuffer() {
return new Uint8Array(1024 * 1024) // 1 MB on heap
}
let buffer = makeBuffer()
buffer = null // eligible for GC if nothing else references the arrayInteractive: stack vs heap
Stack vs Heap Visualizer
Switch scenarios to see where primitives, references, and shared objects live in memory.
let count = 42
let active = true
let label = 'JS'
Stack
Fast, fixed-size frames. Freed when context pops.
Heap
No heap allocations — all values are primitives on the stack.
Objects and functions. Reclaimed by garbage collection when unreachable.
Primitive values are stored directly on the stack — copied by value.
3. Garbage collection
JavaScript engines run automatic garbage collection — you do not manually free heap memory. Modern engines (V8, SpiderMonkey, JavaScriptCore) use optimized generational mark-and-sweep variants.
GC roots
Collection starts from root objects the program can always reach:
- Global object (
window/global) - Variables on the call stack
- Closures and active execution contexts
Anything not reachable from a root is considered garbage.
Reference counting (conceptual)
Each object tracks how many references point to it. When count hits zero, memory is freed.
Flaw: circular references never reach zero:
function createCycle() {
  const a = {}
  const b = {}
  a.ref = b
  b.ref = a
  return 'done'
}
createCycle()
// a and b reference each other but are unreachable from global — reference counting alone would leak
Mark and sweep (modern approach)
- Mark — traverse from roots, mark every reachable object
- Sweep — free everything unmarked
Circular groups with no path from roots are collected correctly.
let cache = { data: new Array(1e6) }
cache = null // object becomes unreachable → swept on next GC cycle
Interactive: garbage collection
Garbage Collection Algorithms
Compare reference counting vs mark-and-sweep — and why modern engines use reachability from roots.
window / global
refs → user, cache
GC root
user
refs → profile
profile
cache
orphan
unreachable
detached
refs → orphan
unreachable
Mark-and-sweep starts from roots (global, call stack, closures). Reachable nodes are marked; everything else is swept — including circular groups with no root path.
| Algorithm | Rule | Weakness |
|---|---|---|
| Reference counting | Free when count = 0 | Circular references |
| Mark and sweep | Free unreachable from roots | Pause times (mitigated by generational GC) |
4. Memory leaks
A memory leak is heap memory that is no longer needed but stays reachable — GC cannot reclaim it. Over time, retained memory grows and performance degrades.
Accidental globals
function init() {
  config = { debug: true } // implicit global in non-strict sloppy mode
}
Fix: 'use strict', const/let, and module scope.
Uncleared timers
const timerId = setInterval(() => {
  const payload = buildHeavyPayload()
  sendAnalytics(payload)
}, 5000)

// Missing: clearInterval(timerId) on page leave
Fix: clearInterval / clearTimeout in React cleanup or route teardown.
Orphan event listeners
window.addEventListener('scroll', handleScroll)

// Component unmounts but listener remains — closure keeps component state alive
Fix:
useEffect(() => {
  window.addEventListener('scroll', handleScroll)
  return () => window.removeEventListener('scroll', handleScroll)
}, [])
Detached DOM references
const cache = []
function onRender(el) {
  cache.push(el) // holds DOM nodes after removal from document
}
Fix: WeakSet / WeakMap, or clear the cache when nodes unmount.
const cache = new WeakSet()
function onRender(el) {
  cache.add(el) // weak reference — does not prevent GC
}
Interactive: memory leak lab
Memory Leak Lab
Toggle between leaky and fixed code — watch how retained references keep heap usage high.
The timer callback keeps firing and retaining new arrays on the heap.
Simulated heap pressure (leak)
90% retained
Memory leak — objects stay reachable and GC cannot reclaim them.
5. Best practices
Use strict mode and block scope
'use strict'

function process(items) {
  for (const item of items) {
    const result = transform(item) // block-scoped — released each iteration
    save(result)
  }
}
Clean up side effects
function connect(url) {
  const ws = new WebSocket(url)
  const heartbeat = setInterval(() => ws.send('ping'), 30_000)

  return () => {
    clearInterval(heartbeat)
    ws.close()
  }
}
Avoid retaining large closures unnecessarily
// Leaky — inner handler closes over entire hugeData
function setup(hugeData) {
  button.addEventListener('click', () => {
    console.log(hugeData.length)
  })
}

// Better — extract only what you need
function setup(hugeData) {
  const len = hugeData.length
  button.addEventListener('click', () => console.log(len))
}
Profile before optimizing
- Open Chrome DevTools → Memory
- Take a heap snapshot before and after an action
- Compare retained size and detached DOM nodes
- Look for growing arrays, closures, and event listener counts
useEffect(() => {
  const controller = new AbortController()

  fetch('/api/data', { signal: controller.signal })
    .then((res) => res.json())
    .then(setData)
    .catch((err) => {
      if (err.name !== 'AbortError') throw err
    })

  return () => controller.abort()
}, [])
Know when WeakMap / WeakSet help
Use weak collections for caches keyed by DOM nodes or objects you do not own — they do not prevent those objects from being collected.
Conclusion
JavaScript memory management follows a clear cycle: allocate when you create values, use them in your program, and release when garbage collection finds them unreachable.
Key takeaways:
- Stack = primitives + call frames; heap = objects accessed by reference
- GC marks reachable objects from roots, then sweeps the rest
- Reference counting fails on circular refs; mark-and-sweep handles them
- Leaks = forgotten globals, timers, listeners, and DOM refs
- Prevent with strict mode, cleanup, weak collections, and profiling
Understanding memory is how you keep SPAs fast and production dashboards stable under load.
Have questions about memory leaks or GC? Reach out via the contact page.
Subscribe to my newsletter
Stay up to date and get notified when I share new contents.
No spam ever, unsubscribe anytime